Absolute Deviation & Variance
Variation
Quartiles are useful, but they are also somewhat limited because they do not take into account every score in our group of data. To get a more representative idea of spread we need to take into account the actual values of each score in a data set. The absolute deviation, variance and standard deviation are such measures.
The absolute and mean absolute deviation show the amount of deviation (variation) that occurs around the mean score. To find the total variability in our group of data, we simply add up the deviation of each score from the mean. The average deviation of a score can then be calculated by dividing this total by the number of scores. How we calculate the deviation of a score from the mean depends on our choice of statistic, whether we use absolute deviation, variance or standard deviation.
Absolute Deviation and Mean Absolute Deviation
Perhaps the simplest way of calculating the deviation of a score from the mean is to take each score and minus the mean score. For example, the mean score for the group of 100 students we used earlier was 58.75 out of 100. Therefore, if we took a student that scored 60 out of 100, the deviation of a score from the mean is 60 - 58.75 = 1.25. It is important to note that scores above the mean have positive deviations (as demonstrated above), whilst scores below the mean will have negative deviations.
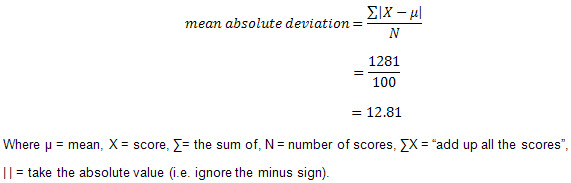
To find out the total variability in our data set, we would perform this calculation for all of the 100 students' scores. However, the problem is that because we have both positive and minus signs, when we add up all of these deviations, they cancel each other out, giving us a total deviation of zero. Since we are only interested in the deviations of the scores and not whether they are above or below the mean score, we can ignore the minus sign and take only the absolute value, giving us the absolute deviation. Adding up all of these absolute deviations and dividing them by the total number of scores then gives us the mean absolute deviation (see below). Therefore, for our 100 students the mean absolute deviation is 12.81, as shown below: