Login

Point-Biserial Correlation using SPSS Statistics

Introduction

A point-biserial correlation is used to measure the strength and direction of the association that exists between one continuous variable and one dichotomous variable. It is a special case of the Pearson’s product-moment correlation, which is applied when you have two continuous variables, whereas in this case one of the variables is measured on a dichotomous scale.

For example, you could use a point-biserial correlation to determine whether there is an association between salaries, measured in US dollars, and gender (i.e., your continuous variable would be "salary" and your dichotomous variable would be "gender", which has two categories: "males" and "females"). Alternately, you could use a point-biserial correlation to determine whether there is an association between cholesterol concentration, measured in mmol/L, and smoking status (i.e., your continuous variable would be "cholesterol concentration", a marker of heart disease, and your dichotomous variable would be "smoking status", which has two categories: "smoker" and "non-smoker").

This "quick start" guide shows you how to carry out a point-biserial correlation using SPSS Statistics, as well as how to interpret and report the results from this test. However, before we introduce you to this procedure, you need to understand the different assumptions that your data must meet in order for a point-biserial correlation to give you a valid result. We discuss these assumptions next.

SPSS Statistics

Assumptions

When you choose to analyse your data using a point-biserial correlation, part of the process involves checking to make sure that the data you want to analyse can actually be analysed using a point-biserial correlation. You need to do this because it is only appropriate to use a point-biserial correlation if your data "passes" five assumptions that are required for a point-biserial correlation to give you a valid result. In practice, checking for these five assumptions just adds a little bit more time to your analysis, requiring you to click a few more buttons in SPSS Statistics when performing your analysis, as well as think a little bit more about your data, but it is not a difficult task.

Before we introduce you to these five assumptions, do not be surprised if, when analysing your own data using SPSS Statistics, one or more of these assumptions is violated (i.e., is not met). This is not uncommon when working with real-world data rather than textbook examples, which often only show you how to carry out a point-biserial correlation when everything goes well! However, don’t worry. Even when your data fails certain assumptions, there is often a solution to overcome this. First, let’s take a look at these five assumptions:

You can check assumptions #3, #4 and #5 using SPSS Statistics. Just remember that if you do not run the statistical tests on these assumptions correctly, the results you get when running a point-biserial correlation might not be valid.

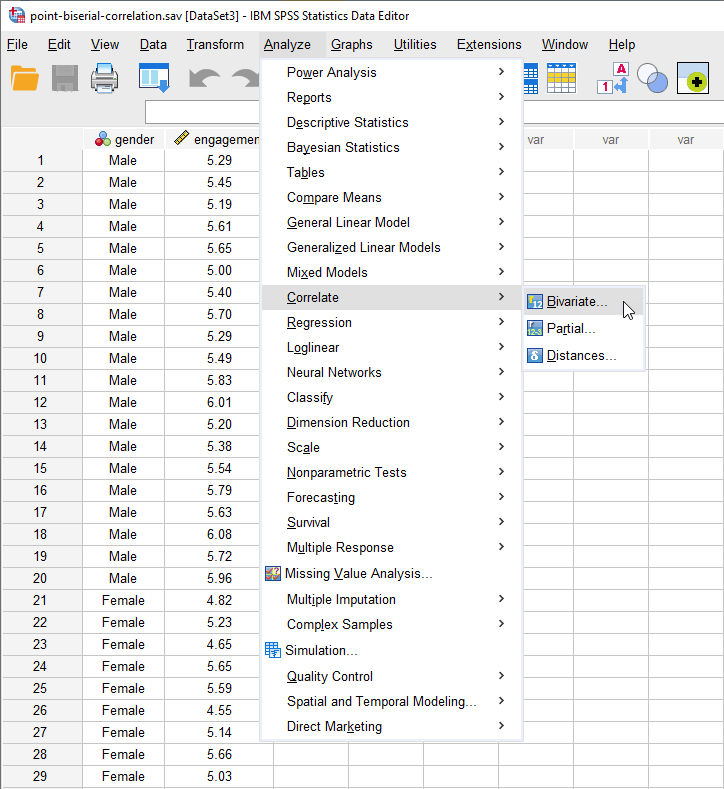
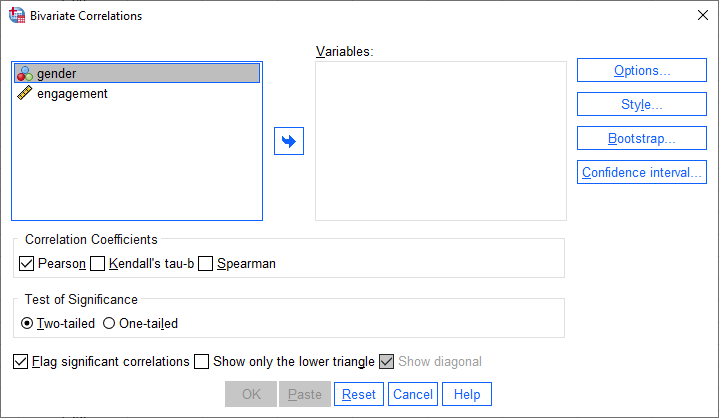
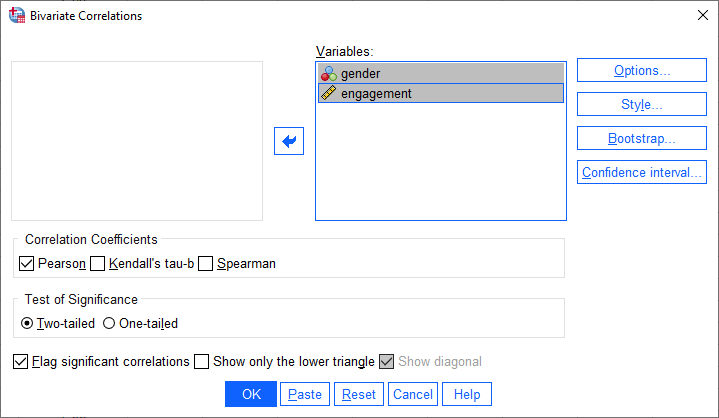
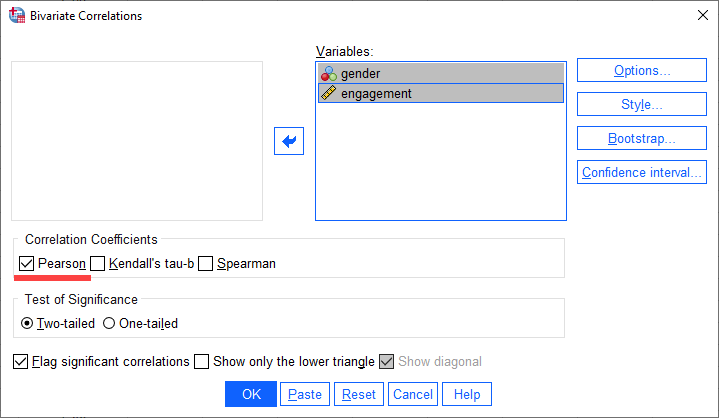
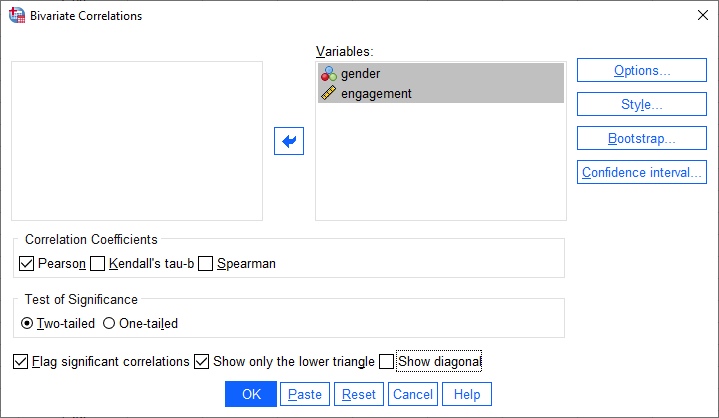
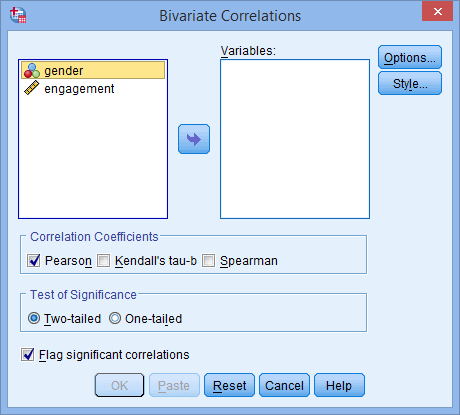
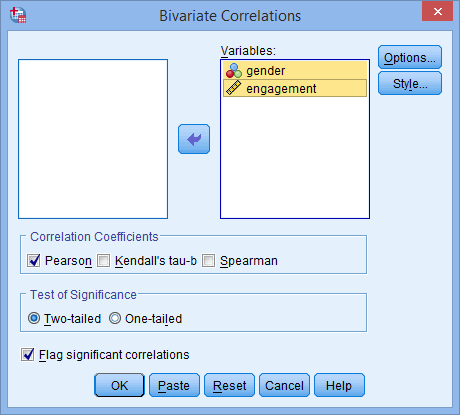
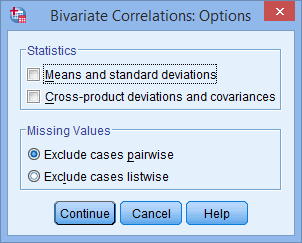
In the section, Procedure, we illustrate the SPSS Statistics procedure to perform a point-biserial correlation assuming that no assumptions have been violated. First, we set out the example we use to explain the point-biserial correlation procedure in SPSS Statistics.

Testimonials
TAKE THE TOUR


SPSS Statistics

Example & Setup in SPSS Statistics

An Advertising Agency wants to determine whether there is a relationship between gender and engagement in the Internet advert. To achieve this, the Internet advert is shown to 20 men and 20 women who are then asked to complete an online survey that measures their engagement with the advertisement. The online survey results in an overall engagement score. After the data is collected, the Advertising Agency decide to use SPSS Statistics to examine the relationship between engagement and gender.

Therefore, two variables were created in the Variable View of SPSS Statistics: gender, which had two categories ("males" and "females") and engagement (i.e., a single score for each individual based on the online survey results that shows their level of engagement with the Internet advert).

Note: These two variables need to be set up properly in the Variable View of SPSS Statistics to run a point-biserial correlation (and avoid the risk of running a Pearson's product-moment correlation by accident).

SPSS Statistics

Test Procedure in SPSS Statistics

The Correlate > Bivariate... procedure below shows you how to analyse your data using a point-biserial correlation in SPSS Statistics when none of the five assumptions in the previous section, Assumptions, have been violated. After this procedure, we show you how to interpret the results from this test.

Since some of the options in the Correlate > Bivariate... procedure changed in SPSS Statistics version 27 and the subscription version of SPSS Statistics, we show how to carry out a point-biserial correlation depending on whether you have SPSS Statistics version 27 or 28 (or the subscription version of SPSS Statistics) or version 26 or an earlier version of SPSS Statistics. The latest versions of SPSS Statistics are version 28 and the subscription version. If you are unsure which version of SPSS Statistics you are using, see our guide: Identifying your version of SPSS Statistics.

SPSS Statistics versions 27 and 28
and the subscription version of SPSS Statistics
  1. Click Analyze > Correlate > Bivariate... on the top menu, as shown below:
    Menu for a point-biserial correlation in SPSS Statistics

    Published with written permission from SPSS Statistics, IBM Corporation.


    You will be presented with the Bivariate Correlations dialogue box, as shown below:
    'Bivariate Correlations' dialogue box for a point-biserial correlation in SPSS. Variables 'gender' & 'engagement' on the left

    Published with written permission from SPSS Statistics, IBM Corporation.

  2. Transfer the variables gender and engagement into the Variables: box by dragging-and-dropping or by clicking on the Right arrow button. You will end up with a screen similar to the one below:
    'Bivariate Correlations' dialogue box for a point-biserial correlation in SPSS. Variables 'gender' & 'engagement' transferred

    Published with written permission from SPSS Statistics, IBM Corporation.

  3. Make sure that the Pearson checkbox is checked in the –Correlation Coefficients– area (although it is selected by default in SPSS Statistics), as shown below:
    'Bivariate Correlations' dialogue box for a point-biserial correlation. 'Pearson' selected in 'Correlation Coefficients' area

    Published with written permission from SPSS Statistics, IBM Corporation.

  4. Select the Show only the lower triangle checkbox and then deselect the Show diagonal checkbox, as shown below:
    'Bivariate Correlations' dialogue box for a point-biserial correlation. 'Only lower triangle' selected in 'Correlation Coefficients' area

    Published with written permission from SPSS Statistics, IBM Corporation.

  5. Click on the OK button.

Now that you have run the Correlate > Bivariate... procedure to carry out a point-biserial correlation, go to the Interpreting Results section. You can ignore the section below, which shows you how to carry out a point-biserial correlation if you have SPSS Statistics version 26 or an earlier version of SPSS Statistics.

Join the 10,000s of students, academics and professionals who rely on Laerd Statistics.TAKE THE TOUR
SPSS Statistics version 26
and earlier versions of SPSS Statistics
  1. Click Analyze > Correlate > Bivariate... on the menu system as shown below:
    Menu for a point-biserial correlation in SPSS Statistics

    Published with written permission from SPSS Statistics, IBM Corporation.


    You will be presented with the following Bivariate Correlations screen:
    'Bivariate Correlations' dialogue box for a point-biserial correlation in SPSS. Variables 'gender' & 'engagement' on the left

    Published with written permission from SPSS Statistics, IBM Corporation.

  2. Transfer the variables gender and engagement into the Variables: box by dragging-and-dropping or by clicking on the Right arrow button. You will end up with a screen similar to the one below:
    'Bivariate Correlations' dialogue box for a point-biserial correlation in SPSS. Variables 'gender' & 'engagement' transferred

    Published with written permission from SPSS Statistics, IBM Corporation.

  3. Make sure that the Pearson checkbox is checked in the –Correlation Coefficients– area (although it is selected by default in SPSS Statistics).
  4. Click on the Options button. If you wish to generate some descriptives, you can do it here by clicking on the relevant checkbox in the –Statistics– area.
    'Bivariate Correlations: Options' dialogue box to generate descriptive statistics for a point-biserial correlation in SPSS Statistics

    Published with written permission from SPSS Statistics, IBM Corporation.

  5. Click on the Continue button.
  6. Click on the OK button.
Join the 10,000s of students, academics and professionals who rely on Laerd Statistics.TAKE THE TOUR
SPSS Statistics

Interpreting the Point-Biserial Correlation

If your data passed assumptions #3 (no outliers), #4 (normality) and #5 (equal variances), which we explained earlier in the Assumptions section, you will only need to interpret the Correlations table. Remember that if your data failed any of these assumptions, the output that you get from the point-biserial correlation procedure (i.e., the table we discuss below), will no longer be correct.

However, in this "quick start" guide, we focus on the results from the point-biserial correlation procedure only, assuming that your data met all the relevant assumptions. Therefore, if you ran the point-biserial correlation procedure in the previous section using SPSS Statistics version 27 or the subscription version of SPSS Statistics, you will be presented with the Correlations table below:

'Correlations' table for a point-biserial correlation in SPSS. Shows 'Pearson Correlation', 'Sig. (2-tailed)' & 'N'

Published with written permission from SPSS Statistics Inc., an IBM Company.

Note: If you ran the point-biserial correlation procedure using SPSS Statistics version 26 or an earlier version of SPSS Statistics, the Correlations table will look like the one below:

'Correlations' table for a point-biserial correlation in SPSS. Shows 'Pearson Correlation', 'Sig. (2-tailed)' & 'N'

The results in this table are identical to those produced in versions 27 and 28 (and the subscription version of SPSS Statistics), but are simply displayed using a different layout (i.e., the results are displayed in a matrix where the correlations are replicated).

The Correlations table actually states that the “Pearson Correlation” has been run because the point-biserial correlation is simply a special case of Pearson’s product-moment correlation, which is applied when you have two continuous variables, whereas in this case one of the variables is measured on a dichotomous scale. Therefore, don’t be concerned that you have run a Pearson’s correlation instead of a point-biserial correlation. As long as you have set up your data correctly in the Variable View of SPSS Statistics, as discussed earlier, a point-biserial correlation will be run automatically by SPSS Statistics.

The Correlations table presents the point-biserial correlation coefficient, the significance value and the sample size that the calculation is based on. In this example, we can see that the point-biserial correlation coefficient, rpb, is -.358, and that this is statistically significant (p = .023).

SPSS Statistics

Reporting the Point-Biserial Correlation

In our example above, you might present the results as follows:

A point-biserial correlation was run to determine the relationship between engagement in an Internet advert and gender. There was a negative correlation between engagement and gender, which was statistically significant (rpb = -.358, n = 40, p = .023).

Join the 10,000s of students, academics and professionals who rely on Laerd Statistics.TAKE THE TOUR
1