Mann-Whitney U Test using SPSS Statistics
Introduction
The Mann-Whitney U test is used to compare differences between two independent groups when the dependent variable is either ordinal or continuous, but not normally distributed. For example, you could use the Mann-Whitney U test to understand whether attitudes towards pay discrimination, where attitudes are measured on an ordinal scale, differ based on gender (i.e., your dependent variable would be "attitudes towards pay discrimination" and your independent variable would be "gender", which has two groups: "male" and "female"). Alternately, you could use the Mann-Whitney U test to understand whether salaries, measured on a continuous scale, differed based on educational level (i.e., your dependent variable would be "salary" and your independent variable would be "educational level", which has two groups: "high school" and "university"). The Mann-Whitney U test is often considered the nonparametric alternative to the independent t-test although this is not always the case.
Unlike the independent-samples t-test, the Mann-Whitney U test allows you to draw different conclusions about your data depending on the assumptions you make about your data's distribution. These conclusions can range from simply stating whether the two populations differ through to determining if there are differences in medians between groups. These different conclusions hinge on the shape of the distributions of your data, which we explain more about later.
In our enhanced Mann-Whitney U test guide, we take you through all the steps required to understand when and how to use the Mann-Whitney U test, showing you the required procedures in SPSS Statistics, and how to interpret and report your output. You can access this enhanced Mann-Whitney U test guide by subscribing to Laerd Statistics. In this "quick start" guide, we show you the basics of the Mann-Whitney U test using one of SPSS Statistics' procedures when the critical assumption of this test is violated. Before we show you how to do this, we explain the different assumptions that your data must meet in order for a Mann-Whitney U test to give you a valid result. We discuss these assumptions next.
SPSS Statistics
Assumptions of the Mann-Whitney U test
When you choose to analyse your data using a Mann-Whitney U test, part of the process involves checking to make sure that the data you want to analyse can actually be analysed using a Mann-Whitney U test. You need to do this because it is only appropriate to use a Mann-Whitney U test if your data "passes" four assumptions that are required for a Mann-Whitney U test to give you a valid result. In practice, checking for these four assumptions just adds a little bit more time to your analysis, requiring you to click a few more buttons in SPSS Statistics when performing your analysis, as well as think a little bit more about your data, but it is not a difficult task.
Before we introduce you to these four assumptions, do not be surprised if, when analysing your own data using SPSS Statistics, one or more of these assumptions is violated (i.e., is not met). This is not uncommon when working with real-world data rather than textbook examples, which often only show you how to carry out a Mann-Whitney U test when everything goes well! However, don’t worry. Even when your data fails certain assumptions, there is often a solution to overcome this. First, let’s take a look at these four assumptions:
- Assumption #1: Your dependent variable should be measured at the ordinal or continuous level. Examples of ordinal variables include Likert items (e.g., a 7-point scale from "strongly agree" through to "strongly disagree"), amongst other ways of ranking categories (e.g., a 5-point scale explaining how much a customer liked a product, ranging from "Not very much" to "Yes, a lot"). Examples of continuous variables include revision time (measured in hours), intelligence (measured using IQ score), exam performance (measured from 0 to 100), weight (measured in kg), and so forth. You can learn more about ordinal and continuous variables in our article: Types of Variable.
- Assumption #2: Your independent variable should consist of two categorical, independent groups. Example independent variables that meet this criterion include gender (2 groups: male or female), employment status (2 groups: employed or unemployed), smoker (2 groups: yes or no), and so forth.
- Assumption #3: You should have independence of observations, which means that there is no relationship between the observations in each group or between the groups themselves. For example, there must be different participants in each group with no participant being in more than one group. This is more of a study design issue than something you can test for, but it is an important assumption of the Mann-Whitney U test. If your study fails this assumption, you will need to use another statistical test instead of the Mann-Whitney U test (e.g., a Wilcoxon signed-rank test). If you are unsure whether your study meets this assumption, you can use our Statistical Test Selector, which is part of our enhanced content.
-
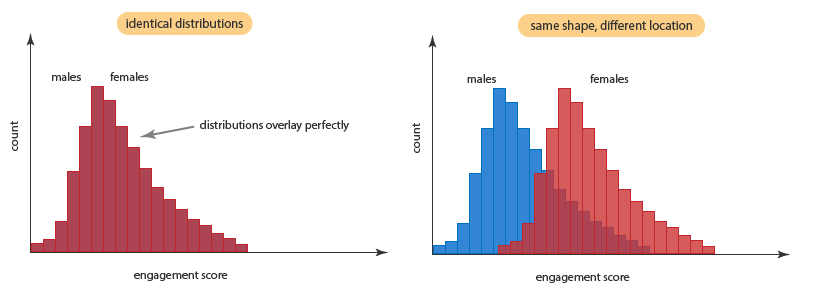
Assumption #4: A Mann-Whitney U test can be used when your two variables are not normally distributed. However, in order to know how to interpret the results from a Mann-Whitney U test, you have to determine whether your two distributions (i.e., the distribution of scores for both groups of the independent variable; for example, 'males' and 'females' for the independent variable, 'gender') have the same shape. To understand what this means, take a look at the diagram below:

Copyright 2013. Laerd Statistics
In the two diagrams above, the distribution of scores for 'males' and 'females' have the same shape. In the diagram on the left, you cannot see the distribution of scores for 'males' (illustrated in blue on the diagram on the right) because the two distributions are identical (i.e., both distributions are identical, so they are 'on top of each other' in the diagram, with the blue-coloured male distribution underneath the red-coloured female distribution). However, in the diagram on the right, even though both distributions have the same shape, they have a different location (i.e., the distribution of one of the groups of the independent variable has higher or lower values compared to the second distribution – in our example, females have 'higher' values than males, overall).
When you analyse your own data, it is extremely unlikely that your two distributions will be identical, but they may have the same (or a 'similar') shape. If they do have the same shape, you can use SPSS Statistics to carry out a Mann-Whitney U test to compare the medians of your dependent variable (e.g., engagement score) for the two groups (e.g., males and females) of the independent variable (e.g., gender) you are interested in. However, if your two distribution have a different shape, you can only use the Mann-Whitney U test to compare mean ranks.
Therefore, when carrying out a Mann-Whitney U test, you must also use SPSS Statistics to determine whether your two distributions have the same shape or a different shape. This requires a few more procedures in SPSS Statistics, but it is an easy step-by-step process that we show you how to do in our enhanced Mann-Whitney U test guide. In this "quick start" guide, we show you how to carry out a Mann-Whitney U test assuming that your two distributions do not have a similar shape, such that you can only compare mean ranks and not medians.
You can check assumption #4 using SPSS Statistics. Before doing this, you should make sure that your data meets assumptions #1, #2 and #3, although you don't need SPSS Statistics to do this. Just remember that if you do not check assumption #4, you will not know whether you are correctly comparing mean ranks or medians, and the results you get when running a Mann-Whitney U test may not be valid. This is why we dedicate a number of sections of our enhanced Mann-Whitney U test guide to help you get this right. You can learn more about assumption #4 and what you will need to interpret in the Assumptions section of our enhanced Mann-Whitney U test guide, which you can access by subscribing to Laerd Statistics.
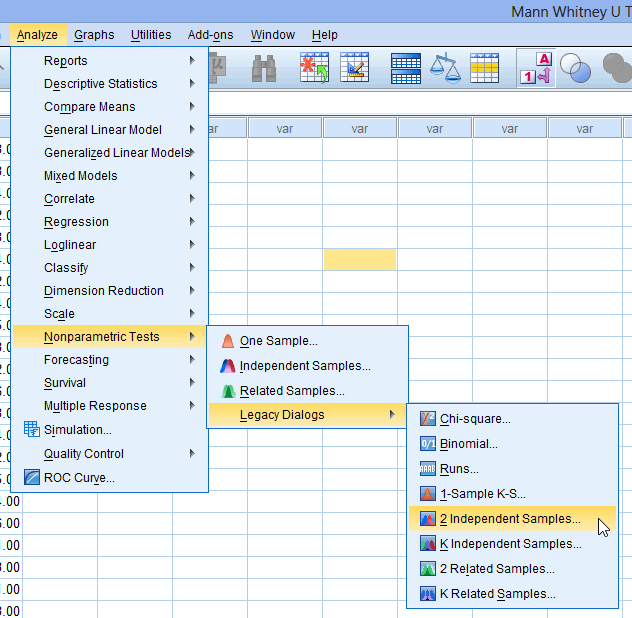
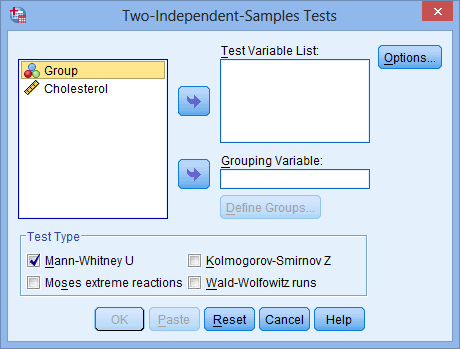
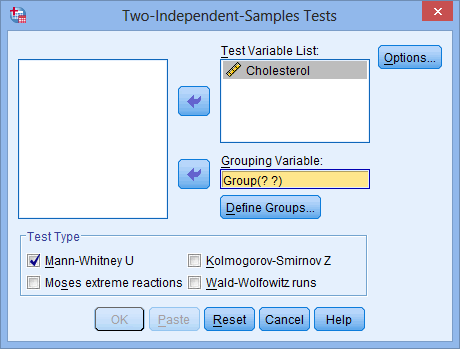
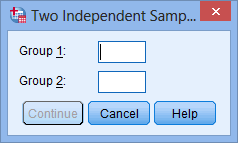
In the Test Procedure in SPSS Statistics section of this "quick start" guide, we illustrate the SPSS Statistics procedure to perform a Mann-Whitney U test assuming that your two distributions are not the same shape and you have to interpret mean ranks rather than medians. First, we set out the example we use to explain the Mann-Whitney U test procedure in SPSS Statistics.