Friedman Test in SPSS Statistics
Introduction
The Friedman test is the non-parametric alternative to the one-way ANOVA with repeated measures. It is used to test for differences between groups when the dependent variable being measured is ordinal. It can also be used for continuous data that has violated the assumptions necessary to run the one-way ANOVA with repeated measures (e.g., data that has marked deviations from normality).
SPSS Statistics
Assumptions of a Friedman test
When you choose to analyse your data using a Friedman test, part of the process involves checking to make sure that the data you want to analyse can actually be analysed using a Friedman test. You need to do this because it is only appropriate to use a Friedman test if your data "passes" the following four assumptions:
- Assumption #1: One group that is measured on three or more different occasions.
- Assumption #2: Group is a random sample from the population.
- Assumption #3: Your dependent variable should be measured at the ordinal or continuous level. Examples of ordinal variables include Likert scales (e.g., a 7-point scale from strongly agree through to strongly disagree), amongst other ways of ranking categories (e.g., a 5-point scale explaining how much a customer liked a product, ranging from "Not very much" to "Yes, a lot"). Examples of continuous variables include revision time (measured in hours), intelligence (measured using IQ score), exam performance (measured from 0 to 100), weight (measured in kg), and so forth. You can learn more about ordinal and continuous variables in our article: Types of Variable.
- Assumption #4: Samples do NOT need to be normally distributed.
The Friedman test procedure in SPSS Statistics will not test any of the assumptions that are required for this test. In most cases, this is because the assumptions are a methodological or study design issue, and not what SPSS Statistics is designed for. In the case of assessing the types of variable you are using, SPSS Statistics will not provide you with any errors if you incorrectly label your variables as nominal.
SPSS Statistics
Example used in this guide
A researcher wants to examine whether music has an effect on the perceived psychological effort required to perform an exercise session. The dependent variable is "perceived effort to perform exercise" and the independent variable is "music type", which consists of three groups: "no music", "classical music" and "dance music". To test whether music has an effect on the perceived psychological effort required to perform an exercise session, the researcher recruited 12 runners who each ran three times on a treadmill for 30 minutes. For consistency, the treadmill speed was the same for all three runs. In a random order, each subject ran: (a) listening to no music at all; (b) listening to classical music; and (c) listening to dance music. At the end of each run, subjects were asked to record how hard the running session felt on a scale of 1 to 10, with 1 being easy and 10 extremely hard. A Friedman test was then carried out to see if there were differences in perceived effort based on music type.
SPSS Statistics
Data setup in SPSS Statistics to carry out a Friedman test
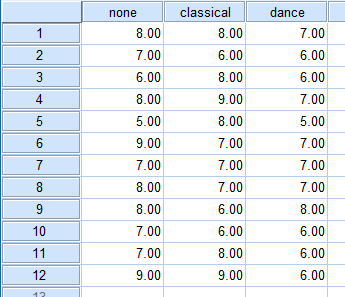
SPSS Statistics puts all repeated measures data on the same row in its Data View. Therefore, you will need as many variables as you have related groups. In our example, we need three variables, which we have labelled "none", "classical" and "dance" to represent the subjects' perceived effort when running based on the three different types of music.

Published with written permission from SPSS Statistics, IBM Corporation.
If you are still unsure how to enter your data correctly, we show you how to do this in our enhanced Friedman test guide. You can learn about our enhanced data setup content on our Features: Data Setup page, or our enhanced guides as a whole on our Features: Overview page.
SPSS Statistics
SPSS Statistics procedure to carry out a Friedman test
The 8 steps below show you how to analyze your data using the Friedman test in SPSS Statistics. We show you the Legacy Dialogs > K Related Samples procedure in SPSS Statistics to run the Friedman test below because this can be used with a wide range of versions of SPSS Statistics. However, you can also run the Friedman test using the Nonparametric Tests > Related Samples procedure in SPSS Statistics, which is available for versions 18 to 30 and the subscription version of SPSS Statistics. This Nonparametric Tests > Related Samples procedure provides additional statistics and more graphical options than the Legacy Dialogs > K Related Samples procedure. Therefore, we show you how to run the Nonparametric Tests > Related Samples procedure and interpret and report the output from it in our enhanced Friedman test guide. You can access the enhanced Friedman test guide by subscribing to Laerd Statistics. At the end of these four steps, we show you how to interpret the results from this test.
Note: The procedure that follows is identical for SPSS Statistics versions 17 to 30, as well as the subscription version of SPSS Statistics, with version 30 and the subscription version being the latest versions of SPSS Statistics. However, in version 27 and the subscription version, SPSS Statistics introduced a new look to their interface called "SPSS Light", replacing the previous look for versions 26 and earlier versions, which was called "SPSS Standard". Therefore, if you have SPSS Statistics versions 27 to 30 (or the subscription version of SPSS Statistics), the images that follow will be light grey rather than blue. However, the procedure is identical.
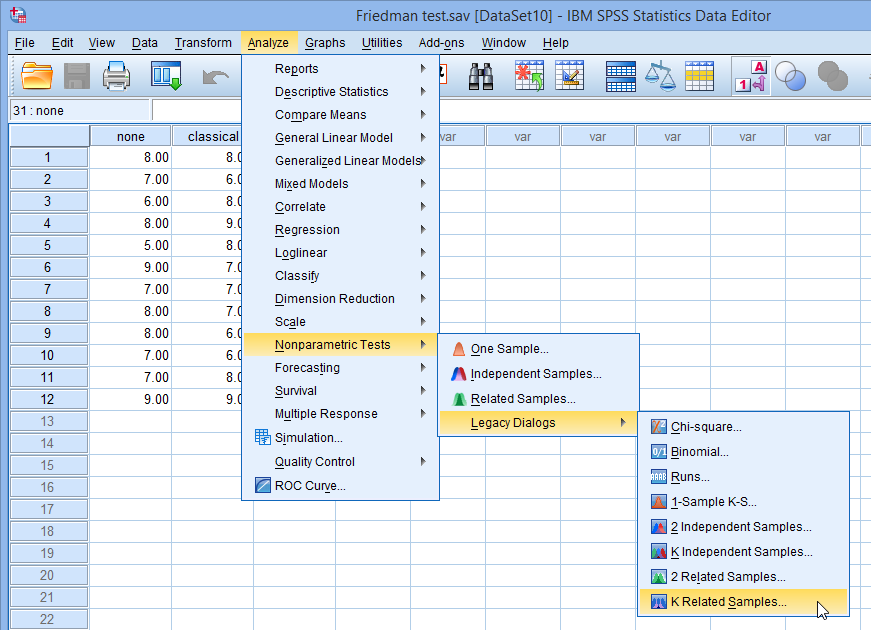
- Click Analyze > Nonparametric Tests > Legacy Dialogs > K Related Samples... on the top menu, as shown below:
Published with written permission from SPSS Statistics, IBM Corporation.
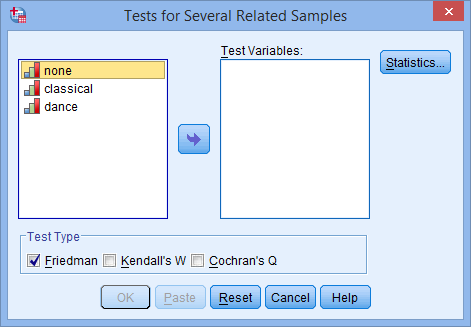
- You will be presented with the Tests for Several Related Samples dialogue box, as shown below:
Published with written permission from SPSS Statistics, IBM Corporation.
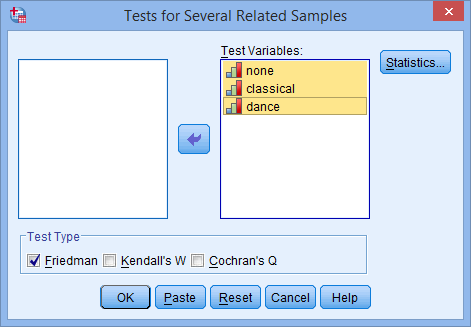
- Transfer the variables none, classical and dance to the Test Variables: box by using the button or by dragging-and-dropping the variables into the box. You will end up with the following screen:
Published with written permission from SPSS Statistics, IBM Corporation.
- Make sure that Friedman is selected in the –Test Type– area.
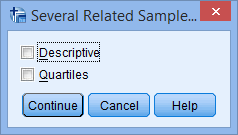
- Click on the button. You will be presented with the following Several Related Samples: Statistics dialogue box, as shown below:
Published with written permission from SPSS Statistics, IBM Corporation.
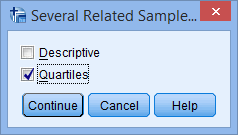
- Tick the Quartiles option:
Note: It is most likely that you will only want to include the Quartiles option as your data is probably unsuitable for Descriptives (i.e., why you are running a non-parametric test). However, SPSS Statistics includes this option anyway.
Published with written permission from SPSS Statistics, IBM Corporation.
- Click on the button. This will return you back to the Tests for Several Related Samples dialogue box, as shown below:
Published with written permission from SPSS Statistics, IBM Corporation.
- Click on the button to run the Friedman test.
SPSS Statistics
Interpreting the SPSS Statistics output from a Friedman test
SPSS Statistics will generate either two or three tables, depending on whether you selected to have descriptives and/or quartiles generated in addition to running the Friedman test.
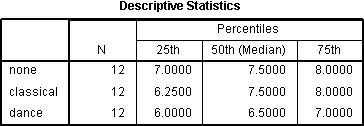
Descriptive Statistics Table
The Descriptives Statistics table will be produced if you selected the Quartiles option:
Published with written permission from SPSS Statistics, IBM Corporation.
This is a very useful table because it can be used to present descriptive statistics in your results section for each of the time points or conditions (depending on your study design) for your dependent variable. This usefulness will be presented in the "Reporting the Output" section later.
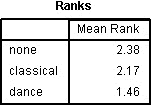
Ranks Table
The Ranks table shows the mean rank for each of the related groups, as shown below:
Published with written permission from SPSS Statistics, IBM Corporation.
The Friedman test compares the mean ranks between the related groups and indicates how the groups differed, and it is included for this reason. However, you are not very likely to actually report these values in your results section, but most likely will report the median value for each related group.
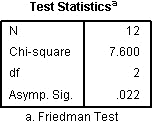
Test Statistics Table
The Test Statistics table informs you of the actual result of the Friedman test, and whether there was an overall statistically significant difference between the mean ranks of your related groups. For the example used in this guide, the table looks as follows:
Published with written permission from SPSS Statistics, IBM Corporation.
The table above provides the test statistic (χ2) value ("Chi-square"), degrees of freedom ("df") and the significance level ("Asymp. Sig."), which is all we need to report the result of the Friedman test. From our example, we can see that there is an overall statistically significant difference between the mean ranks of the related groups. It is important to note that the Friedman test is an omnibus test, like its parametric alternative; that is, it tells you whether there are overall differences, but does not pinpoint which groups in particular differ from each other. To do this you need to run post hoc tests, which will be discussed after the next section.
SPSS Statistics
Reporting the results from a Friedman test (without post hoc tests)
You can report the Friedman test result as follows:
There was a statistically significant difference in perceived effort depending on which type of music was listened to whilst running, χ2(2) = 7.600, p = 0.022.
You could also include the median values for each of the related groups. However, at this stage, you only know that there are differences somewhere between the related groups, but you do not know exactly where those differences lie. Remember though, that if your Friedman test result was not statistically significant, you should not run post hoc tests.
Post Hoc Tests
To examine where the differences actually occur, you need to run separate Wilcoxon signed-rank tests on the different combinations of related groups. So, in this example, you would compare the following combinations:
- None to Classical.
- None to Dance.
- Classical to Dance.
You need to use a Bonferroni adjustment on the results you get from the Wilcoxon tests because you are making multiple comparisons, which makes it more likely that you will declare a result significant when you should not (a Type I error). Luckily, the Bonferroni adjustment is very easy to calculate; simply take the significance level you were initially using (in this case, 0.05) and divide it by the number of tests you are running. So in this example, we have a new significance level of 0.05/3 = 0.017. This means that if the p value is larger than 0.017, we do not have a statistically significant result.
Running these tests (see how with our Wilcoxon signed-rank test guide) on the results from this example, you get the following result:
Published with written permission from SPSS Statistics, IBM Corporation.
This table shows the output of the Wilcoxon signed-rank test on each of our combinations. It is important to note that the significance values have not been adjusted in SPSS Statistics to compensate for multiple comparisons – you must manually compare the significance values produced by SPSS Statistics to the Bonferroni-adjusted significance level you have calculated. We can see that at the p < 0.017 significance level, only perceived effort between no music and dance (dance-none, p = 0.008) was statistically significantly different.
SPSS Statistics
Reporting the results from a Friedman test (with post hoc tests)
You can report the Friedman test with post hoc tests results as follows:
There was a statistically significant difference in perceived effort depending on which type of music was listened to whilst running, χ2(2) = 7.600, p = 0.022. Post hoc analysis with Wilcoxon signed-rank tests was conducted with a Bonferroni correction applied, resulting in a significance level set at p < 0.017. Median (IQR) perceived effort levels for the no music, classical and dance music running trial were 7.5 (7 to 8), 7.5 (6.25 to 8) and 6.5 (6 to 7), respectively. There were no significant differences between the no music and classical music running trials (Z = -0.061, p = 0.952) or between the classical and dance music running trials (Z = -1.811, p = 0.070), despite an overall reduction in perceived effort in the dance vs classical running trials. However, there was a statistically significant reduction in perceived effort in the dance music vs no music trial (Z = -2.636, p = 0.008).