Cochran's Q test using SPSS Statistics
Introduction
Cochran's Q test is used to determine if there are differences on a dichotomous dependent variable between three or more related groups. It can be considered to be similar to the one-way repeated measures ANOVA, but for a dichotomous rather than a continuous dependent variable, or as an extension of McNemar's test. Cochran's Q test is commonly used to analyse longitudinal study designs, as well as being used when analysing participants that have undergone multiple different trials (a.k.a. treatments/conditions).
For example, you could use Cochran's Q test to determine whether the proportion of participants who had low self-esteem (as opposed to high self-esteem) decreased after a series of three counselling sessions (i.e., your dependent variable would be "level of self-esteem", which has two categories: "low" and "high", measured at four time points: "before the first counselling session", "after the second counselling session", "after the third counselling session" and "after the final counselling session"). Alternatively, you could use Cochran's Q test to determine whether the proportion of female participants who felt safe (yes or no) differed when carrying mace, an alarm or nothing at all (i.e., the dependent variable would be "sense of safety", which has two categories: "safe" or "not safe", measured across three treatments/conditions: "mace", "alarm" and "nothing").
When you run a Cochran's Q test, you will either get a statistically significant result or a non-statistically significant result. If your result is not statistically significant, it indicates that the percentages/proportions at the different time points or under the different treatments/conditions are the same in the population. In this circumstance, it is not necessary to follow up your results with a post hoc analysis. However, if you did get a statistically significant result, you will probably want to follow up your Cochran's Q test with a post hoc analysis. You will want to do this because Cochran's Q test is an omnibus test. That is, it tells you that there are differences in the proportions between three or more related groups, but it does not tell you which specific groups differed from each other (e.g., it will tell you that the proportion of female participants who felt safe differed based on whether they carried "mace", an "alarm" or "nothing at all", but it will not tell you which of these three treatments/conditions made females feel more safe). A post hoc analysis will allow you to do this.
This "quick start" guide shows you how to carry out Cochran's Q test using SPSS Statistics, as well as interpret and report the results from this test. However, before we introduce you to this procedure, you need to understand the different assumptions that your study design must meet in order for Cochran's Q test to be an appropriate choice of test. We discuss these assumptions next.
SPSS Statistics
Assumptions
Cochran's Q test has four assumptions that must be met. If these assumptions are not met, you cannot use Cochran's Q test, but may be able to use another statistical test instead. Therefore, in order to run Cochran's Q test, you need to check that your study design meets the following four assumptions:
- Assumption #1: You have one dependent variable with two, mutually exclusive groups (i.e., the variable is dichotomous). Examples of dichotomous variables include perceived safety (two groups: "safe" and "unsafe"), exam performance (two groups: "pass" and "fail"), preferred choice of cereal brand (two groups: "brand A" and "brand B"), feeling of seasickness (two groups: "yes" and "no"), level of exhaustion (two groups: "low" and "high"), use of safety equipment (two groups: "uses safety helmet" and "doesn't use safety helmet"), skin cream effectiveness (two groups: "rash" and "no rash"), and so forth. You can learn more about dichotomous variables in our article: Types of Variable.
Mutually exclusive means that a participant cannot be in more than one group at the same time. For example, imagine you were using Cochran's Q test to determine whether the proportion of participants who passed an exam (as opposed to failing the exam) before a two week revision period (i.e., an intervention) increased after the intervention (i.e., your dependent variable would be "exam performance", which has two categories: "pass" and "fail"). When a participant took the exam before the two week revision period, they could have only "passed" it or "failed" it. They could not pass and fail at the same time (e.g., they either got 60 out of 100 marks and above, which was a "pass", or 59 marks and below, which was a "fail"). Similarly, after the two week revision period, the participant could still only either pass or fail the exam.
- Assumption #2: You have one independent variable that consists of three or more categorical, related groups (i.e., your independent variable is an ordinal or nominal variable).
Examples of ordinal variables include Likert items (e.g., a 7-point scale from "strongly agree" through to "strongly disagree"), physical activity level (e.g., 4 groups: sedentary, low, moderate and high), customers liking a product (ranging from "Not very much", to "It is OK", to "Yes, a lot"), and so forth. Examples of nominal variables include ethnicity (e.g., three groups: "Caucasian", "African American" and "Hispanic") and profession (e.g., four groups: "doctor", "nurse", "dentist" and "therapist").
Related groups indicates that the three or more groups are not independent. The primary reason for having related groups is having the same participants in each group. It is possible to have the same participants in each group when each participant has been measured on two or more occasions on the same dependent variable. For example, you might have measured 10 individuals' performance in a spelling test (the dependent variable) before, midway and after they underwent a new form of computerized teaching method to improve spelling. You would like to know if the computer training improved their spelling performance. The first related group consists of the participants at the beginning (prior to) the computerized spelling training, the second related group consists of the same participants at the midway point through the computerized training and the third related group consists of the same participants at the end of the computerized training. Alternatively, you may have measured 20 individuals' task performance (the dependent variable) when working in three different lighting conditions (e.g., blue, red and natural lighting) to determine whether task performance was affected by the colour of the lighting in the room.
- Assumption #3: The cases (e.g., participants) are a random sample from the population of interest. However, in practice, this is not always how sampling took place.
- Assumption #4: Your sample size is sufficiently large that you can interpret the asymptotic p-value produced by Cochran's Q test (i.e., a p-value is the value that you consult to determine if there is a statistically significant difference in proportions between your three or more related groups). If your sample size is inadequate, the asymptotic p-value may not be accurate, but you can run an "exact" version of Cochran's Q test that will generate a more accurate exact p-value.
Therefore, before you can carry out your analysis, you need to know whether your data has met or violated this sample size assumption. It is important not only because it affects whether you need to run the "standard" Cochran's Q test (as shown in the Test Procedure in SPSS Statistics section below) or an "exact" version of Cochran's Q test, but it also will determine what post hoc test you carry out (i.e., since there is more than one type of post hoc test you can carry out after running Cochran's Q test). In this "quick start" guide, we just set out and explain the "standard" Cochran's Q test, but in our enhanced Cochran's Q test that is available if you choose to become a member of Laerd Statistics, we explain: (a) how to test the sample size assumption of Cochran's Q test using SPSS Statistics; (b) how to interpret whether your data has met or violated this assumption; and (c) how to run the "exact" version of Cochran's Q test using SPSS Statistics if your data violates this assumption.
If your study design does not meet these four assumptions, you cannot use Cochran's Q test, but you may be able to use another statistical test instead (learn more about our Statistical Test Selector if this is the case). However, assuming that you are using the correct test, we show you how to analyse your data using Cochran's Q test later in the Test Procedure in SPSS Statistics section. First, we introduce you to the example we use in this guide.
SPSS Statistics
Example
A school teacher wanted to examine whether pass rates increased as students had more time to study. In this hypothetical study, 60 students were recruited to take part. All students were first given a "surprise exam" to test their current knowledge. They were then given a "mock exam" two weeks later before they took a "final exam" a further two weeks later. Students' performance in the exams were assessed in terms of a "pass" or "fail".
Due to the same students being measured on three occasions (i.e., during the "surprise", "mock" and "final" exam), we have repeated measures. We also have a dependent variable that is dichotomous with two mutually exclusive categories (i.e., "Failed" and "Passed"). As a result, Cochran's Q test is the appropriate choice to analyse the data.
SPSS Statistics
Setup in SPSS Statistics
For Cochran's Q test, you will have at least three variables (i.e., as many variables as you have related groups). In our example, we have three related groups – the "surprise exam", "mock exam" and "final exam" – so we have three variables:
(1) The dichotomous responses for the first of your related groups (e.g., surprise_exam, which reflects whether students "Passed" or "Failed" their surprise exam);
(2) The dichotomous responses for the second of your related groups (e.g., mock_exam, which reflects whether students "Passed" or "Failed" their mock exam); and
(3) The dichotomous responses for the third of your related groups (e.g., final_exam, which reflects whether students "Passed" or "Failed" their final exam).
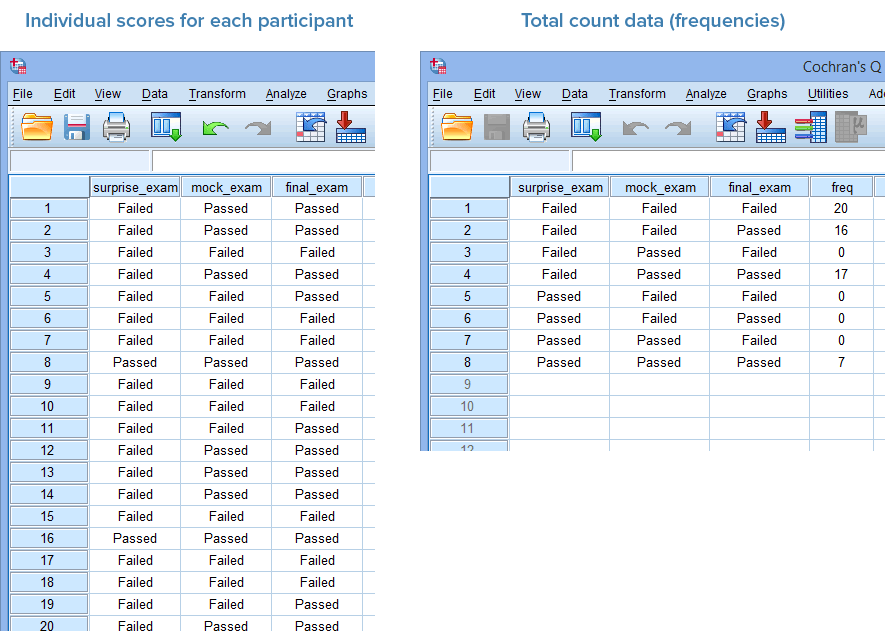
In addition, if you have entered your data into SPSS Statistics using frequencies (i.e., total counts) rather than entering the individual scores for each participant, you will have one more variable, frequencies (i.e., captured in the variable, freq).
In the diagram below, we show you how you would have set up your data in the Data View of SPSS Statistics if you had entered your data using: (a) the individual scores for each participant (shown in the diagram on the left below), where you only have three variables; or (b) total count data, also known as frequencies (shown in the diagram on the right below), where you have four variables.

Published with written permission from SPSS Statistics, IBM Corporation.
Just remember that if you have entered your data using total count data (i.e., frequencies), shown in the diagram on the right above, you will also have to weight your cases before you can analyse your data (i.e., this is an additional procedure in SPSS Statistics). If you do not use the Weight cases... procedure in SPSS Statistics before running Cochran's Q test procedure in the next section, your analysis will fail.
Note: If you are unsure how to set up your data in SPSS Statistics for the two data setup scenarios above, we explain how to do this in our enhanced Cochran's Q test guide. We also provide two data files – one for each of the two data setups above – so that you can practice using our example before running Cochran's Q test on your own data.
SPSS Statistics
Test Procedure in SPSS Statistics
The four steps below show you how to analyse your data using the "standard" Cochran's Q test in SPSS Statistics. At the end of these four steps, we show you how to interpret the results from this test.
Note 1: We show you the Legacy Dialogs > K Related Samples procedure in SPSS Statistics to run Cochran's Q test below because this can be used with a wide range of versions of SPSS Statistics. However, you can also run Cochran's Q test using the Nonparametric Tests > Related Samples procedure in SPSS Statistics, which is available for versions 18 to 28 and the subscription version of SPSS Statistics. This Nonparametric Tests > Related Samples procedure provides additional statistics and more graphical options than the Legacy Dialogs > K Related Samples procedure. Therefore, we show you how to run the Nonparametric Tests > Related Samples procedure and interpret and report the output from it in our enhanced Cochran's Q test guide. You can access the enhanced Cochran's Q test guide by subscribing to Laerd Statistics.
Note 2: The procedure that follows is identical for SPSS Statistics versions 17 to 28, as well as the subscription version of SPSS Statistics, with version 28 and the subscription version being the latest versions of SPSS Statistics. However, in version 27 and the subscription version, SPSS Statistics introduced a new look to their interface called "SPSS Light", replacing the previous look for versions 26 and earlier versions, which was called "SPSS Standard". Therefore, if you have SPSS Statistics versions 27 or 28 (or the subscription version of SPSS Statistics), the images that follow will be light grey rather than blue. However, the procedure is identical.
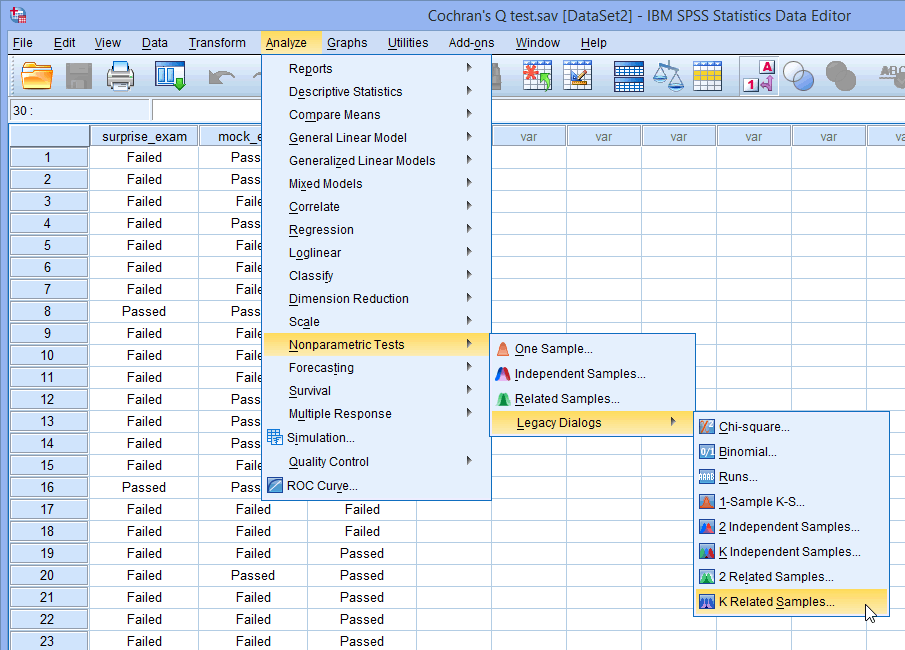
- Click Analyze > Nonparametric Tests > Legacy Dialogs > K Related Samples... on the main menu, as shown below:
Published with written permission from SPSS Statistics, IBM Corporation.
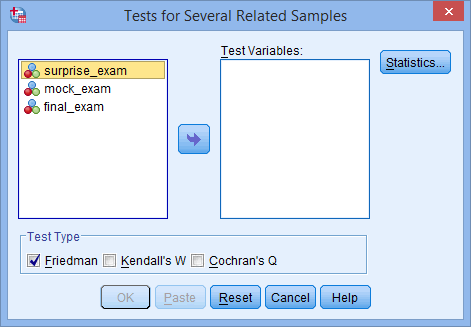
You will be presented with the Tests for Several Related Samples dialogue box, as shown below:
Published with written permission from SPSS Statistics, IBM Corporation.
- Transfer the variables surprise_exam, mock_exam and final_exam into the Test Variables: box by dragging-and-dropping or by clicking the button. You will end up with a screen similar to the one below:
Published with written permission from SPSS Statistics, IBM Corporation.
- Make sure that you uncheck the Friedman checkbox (it is selected by default in SPSS Statistics) and check the Cochran's Q checkbox in the –Test Type– area, as shown below:
Published with written permission from SPSS Statistics, IBM Corporation.
- Click on the button to generate the output.
Now that you have run the "standard" Cochran's Q test procedure, we show you how to interpret and report your results.
SPSS Statistics
Interpreting the results of Cochran's Q test
SPSS Statistics generates two main tables of output for the "standard" Cochran's Q test when using the Legacy Dialogs > K Related Samples procedure: the Frequencies table and Test Statistics table. These are discussed in turn below:
Note: We refer to the "standard" Cochran's Q test because if you violated the sample size assumption discussed above, such that you had to run an "exact" version of Cochran's Q test, the results below may not be accurate. However, from this point forward, we will just refer to Cochran's Q test rather than the "standard" Cochran's Q test for ease.
Frequencies Table
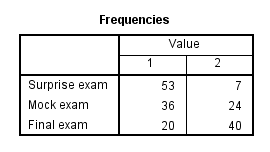
It is important when reporting Cochran's Q test result that you also interpret and report descriptive statistics in order to get a 'feel' for your data, as well as to provide an appropriate description of your data. One important measure that we can report is the number of participants that passed and failed each of the three exams: the surprise exam, mock exam and final exam. This is illustrated in the results generated in the Frequencies table, as shown below:
Published with written permission from SPSS Statistics, IBM Corporation.
Note: The titles in the Value column will reflect the coding you used when setting up your three or more variables in the Variable View of SPSS Statistics. In our example, "1" reflects the number of students who "failed" the exam and "2" reflects the number of students who "passed" the exam. The left-hand column will consist of the three or more variables in your study (i.e., "Surprise exam", "Mock exam" and "Final exam" in our example).
You can see from the Frequencies table that 53 students failed and 7 students passed the surprise exam, whereas 36 students failed and 24 passed the mock exam. Finally, 20 students failed the final exam, whereas 40 passed. In the sense that the study was designed to evaluate the change in the proportion of pass and failure rates as student had more time to revise, it appears that failure rates decreased across the three exams (i.e., as students had more time to revise). However, although it can appear that these proportions are different, the differences could simply be due to sampling variation. Therefore, to establish whether these proportions of passes are different in the population and are not simply due to sampling variation, you need to consult the Cochran's Q test result, as set out in the next section.
Test Statistics Table
Now that we know the proportion of students who passed and failed the three exams – the surprise, mock and final exams – we would like to know whether these proportions are statistically significantly different. To know this, we can use the result of Cochran's Q test, which can be found in the Test Statistics table below:
Published with written permission from SPSS Statistics, IBM Corporation.
If the statistical significance value (i.e., p-value) is less than .05 (i.e., p < .05), you have a statistically significant result and the proportion of students who passed and failed their exams across the three exams is statistically significantly different. Alternatively, if p > .05, you do not have a statistically significant result and the proportion of students who passed and failed their exams across the three exams is not statistically significantly different (i.e., the proportion of passes does not change over the course of the exams as students have more time to revise). In our example, p = .000 (i.e., p < .0005), which means that the proportion of students who passed their exams is statistically significantly different across the three exams.
Decision Time
Option 1: If you do not have a statistically significant Cochran's Q test – using either the "standard" Cochran's Q test or the "exact" version of Cochran's Q test – you do not need to run a post hoc test. You can go straight to our Reporting section.
Option 2: If you have a statistically significant Cochran's Q test using the "standard" Cochran's Q test, you can carry out a post hoc test using either Dunn's test (which also automatically applies a Bonferroni correction) or multiple McNemar's tests (where you need to make a manual Bonferroni correction).
Option 3: If you have a statistically significant Cochran's Q test using the "exact" version of Cochran's Q test, you can carry out a post hoc test using multiple McNemar's tests (where you need to make a manual Bonferroni correction).
If you have a statistically significant result and want to carry on with your analysis using a post hoc test (i.e., either Option 2 or Option 3 above), we show you how to do this in our enhanced guide, which is available if you choose to become a member of Laerd Statistics. This includes an explanation of: (a) the SPSS Statistics procedures required to carry out Dunn's post hoc test or multiple McNemar's tests (with Bonferroni correction); (b) how to interpret the results from both of these post hoc tests, including how to interpret these results when you met or violated the sample size assumption of Cochran's Q test, which was briefly set out above.
SPSS Statistics
Reporting the results of Cochran's Q test
Based on the SPSS Statistics output above, we could report the results of the study as follows:
Sixty participants were recruited to take part in study to examine whether pass rates changed over three exams – a surprise, mock and final exam – as students had more time to study. Cochran's Q test determined that there was a statistically significant difference in the proportion of students who passed their exams over time, χ2(2) = 49.515, p < .0005.