Chi-Square Goodness-of-Fit Test in SPSS Statistics
Introduction
The chi-square goodness-of-fit test is a single-sample nonparametric test, also referred to as the one-sample goodness-of-fit test or Pearson's chi-square goodness-of-fit test. It is used to determine whether the distribution of cases (e.g., participants) in a single categorical variable (e.g., "gender", consisting of two groups: "males" and "females") follows a known or hypothesised distribution (e.g., a distribution that is "known", such as the proportion of males and females in a country; or a distribution that is "hypothesised", such as the proportion of males versus females that we anticipate voting for a particular political party in the next elections). The proportion of cases expected in each group of the categorical variable can be equal or unequal (e.g., we may anticipate an "equal" proportion of males and females voting for the Republican Party, or an "unequal" proportion, with 70% of those voting for the Republican Party being male and only 30% female).
When you carry out a chi-square goodness-of-fit test, "hypothesising" whether you expect the proportion of cases in each group of your categorical variable to be "equal" or "unequal" is critical. Not only is it an important aspect of your research design, but from a practical perspective, it will determine how you carry out the chi-square goodness-of-fit test in SPSS Statistics, as well as how you interpret and write up your results.
In this "quick start" guide, we show you how to carry out a chi-square goodness-of-fit test using SPSS Statistics when you have "equal" expected proportions (e.g., you anticipated an "equal" proportion of males and females voting for the Republican Party). In addition, we explain how to interpret the results from this test. However, if you have "unequal" expected proportions (e.g., you anticipated 70% of those voting for the Republican Party being male and only 30% female), we show you how to do this in our enhanced chi-square goodness-of-fit guide (N.B., you can learn about our enhanced content on our Features: Overview page). Therefore, assuming that you would like to know the SPSS Statistics procedure and interpretation of the chi-square goodness-of-fit test when you have equal expected proportions, you first need to understand the different assumptions that your data must meet in order for a chi-square goodness-of-fit to give you a valid result. We discuss these assumptions next.
SPSS Statistics
Basic requirements and assumptions of the chi-square goodness-of-fit test
When you choose to analyse your data using the chi-square goodness-of-fit test, part of the process involves checking to make sure that the data you want to analyse can actually be analysed using a chi-square goodness-of-fit test. You need to do this because it is only appropriate to use a chi-square goodness-of-fit test if your data meets four assumptions that are required for a chi-square goodness-of-fit test to give you a valid result. In practice, checking for these assumptions is a relatively simple process, only requiring you to use SPSS Statistics. Let’s take a look at these four assumptions:
- Assumption #1: One categorical variable (i.e., the variable can be dichotomous, nominal or ordinal). Examples of dichotomous variables include gender (2 groups: male or female), treatment type (2 groups: medication or no medication), educational level (2 groups: undergraduate or postgraduate) and religious (2 groups: yes or no). Examples of nominal variables include ethnicity (e.g., 3 groups: Caucasian, African American and Hispanic), and profession (e.g., 5 groups: surgeon, doctor, nurse, dentist, therapist). Examples of ordinal variables include Likert scales (e.g., a 7-point scale from "strongly agree" through to "strongly disagree"), amongst other ways of ranking categories (e.g., a 5-point scale for measuring job satisfaction, ranging from "most satisfied" to "least satisfied"; a 4-point scale determining how easy it was to navigate a new website, ranging from "very easy" to "very difficult; or a 3-point scale explaining how much a customer liked a product, ranging from "Not very much", to "It is OK", to "Yes, a lot"), and physical activity level (e.g., 4 groups: sedentary, low, moderate and high).
- Assumption #2: You should have independence of observations, which means that there is no relationship between any of the cases (e.g., participants).
- Assumption #3: The groups of the categorical variable must be mutually exclusive. For example, if the four groups of a categorical variable, Physical Activity Level, were "Sedentary", "Low", "Moderate" and "High", a case (e.g., a participant in an exercise study) could only be in one of these four groups (e.g., a participant could not be classified as having a "High" activity level and a "Low" activity level, but only one or the other).
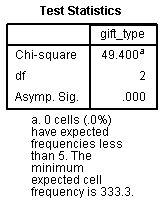
- Assumption #4: There must be at least 5 expected frequencies in each group of your categorical variable. This is an assumption of the chi-square goodness-of-fit test and will be shown in your SPSS Statistics output when you run the test.
Therefore, before proceeding, check that your study design meets assumptions #1, #2 and #3. Assuming they do, you will now need to check that your data meets assumption #4, which you can do using SPSS Statistics. We explain how to test for assumption #4 and how to interpret the SPSS Statistics output in our enhanced chi-square goodness-of-fit guide to help you get this right. You can find out about our enhanced content as a whole on our Features: Overview page, or more specifically, learn how we help with testing assumptions on our Features: Assumptions page.
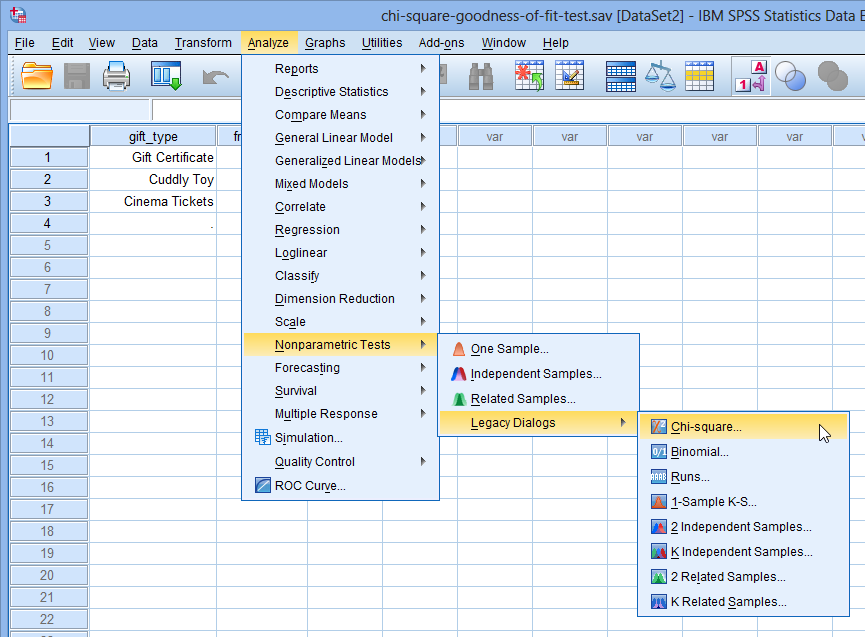
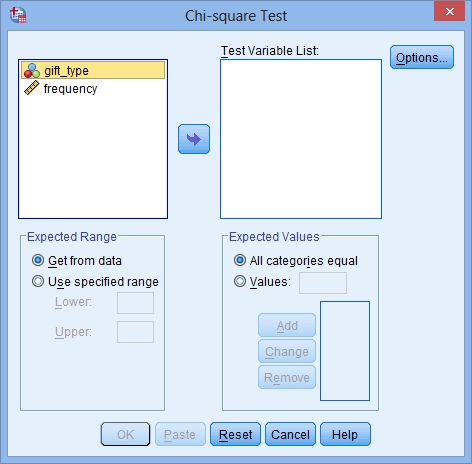
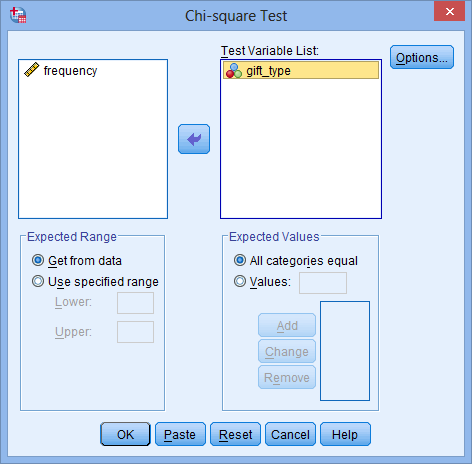
In the section, Procedure, we illustrate the SPSS Statistics procedure required to perform a chi-square goodness-of-fit test assuming that no assumptions have been violated and when you have equal expected proportions. First, we set out the example we use to explain the chi-square goodness-of-fit procedure in SPSS Statistics.
SPSS Statistics
Example used in this guide
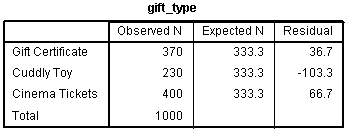
A website owner, Christopher, wants to offer a free gift to people that purchase a subscription to his website. New subscribers can choose one of three gifts of equal value: a gift voucher, a cuddly toy or free cinema tickets. After 1000 people have signed up, Christopher wants to review the figures to see if the three gifts offered were equally popular.
In this case, the three gifts – a gift voucher, a cuddly toy or free cinema tickets – reflect the three groups of the categorical variable, gift_type. The 1000 people that have signed up reflect the "cases" (i.e., cases can be anything from "people", to "animals", "objects", "organisations", and so forth).
SPSS Statistics
Data setup in SPSS Statistics to carry out a chi-square goodness-of-fit test
There are two methods of entering data into SPSS Statistics in order to run a chi-square goodness-of-fit test in SPSS Statistics. Common to both methods is a column in the SPSS Statistics data file for the categorical variable, which in this example, we shall name gift_type. We have assigned codes of "1" for the gift certificate, which we labelled "Gift Certificate", "2" for the cuddly toy, which we labelled "Cuddly Toy", and "3" for the free cinema tickets, which we labelled "Cinema Tickets". If the frequency data has already been summated for the various categories, we need to create a second column that contains the respective frequency counts; we have called this variable frequency. This type of data entry is shown below:
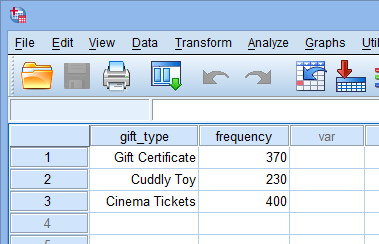
Published with written permission from SPSS Statistics, IBM Corporation.
Note: If you have entered your data in this way, you cannot run the chi-square goodness-of-fit test without first "weighting" your cases. This is a procedure that tells SPSS Statistics that you have summated your categories. It is required because it changes the way that SPSS Statistics deals with your data in order to run the chi-square goodness-of-fit test. If you are unsure how to weight your cases, we show you how to do this in our enhanced chi-square goodness-of-fit guide.
Alternatively, you may have the data in raw form (i.e., you have not summated the frequencies). In this case, you do not need a second column as SPSS Statistics can calculate the frequencies of occurrence of each category for you. This would mean that, in this example, there are 1000 rows of data, of which the beginning of said data is shown below:
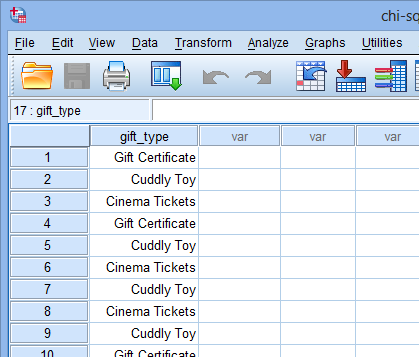
Published with written permission from SPSS Statistics, IBM Corporation.
If you are still unsure how to enter your data accurately into the Data View and Variable View of SPSS Statistics, we should you how to do this in our enhanced chi-square goodness-of-fit test guide. You can learn about our enhanced data setup content on our Features: Data Setup page.