Kruskal-Wallis H Test using SPSS Statistics
Introduction
The Kruskal-Wallis H test (sometimes also called the "one-way ANOVA on ranks") is a rank-based nonparametric test that can be used to determine if there are statistically significant differences between two or more groups of an independent variable on a continuous or ordinal dependent variable. It is considered the nonparametric alternative to the one-way ANOVA, and an extension of the Mann-Whitney U test to allow the comparison of more than two independent groups.
For example, you could use a Kruskal-Wallis H test to understand whether exam performance, measured on a continuous scale from 0-100, differed based on test anxiety levels (i.e., your dependent variable would be "exam performance" and your independent variable would be "test anxiety level", which has three independent groups: students with "low", "medium" and "high" test anxiety levels). Alternately, you could use the Kruskal-Wallis H test to understand whether attitudes towards pay discrimination, where attitudes are measured on an ordinal scale, differed based on job position (i.e., your dependent variable would be "attitudes towards pay discrimination", measured on a 5-point scale from "strongly agree" to "strongly disagree", and your independent variable would be "job description", which has three independent groups: "shop floor", "middle management" and "boardroom").
Note: If you wish to take into account the ordinal nature of an independent variable and have an ordered alternative hypothesis, you could run a Jonckheere-Terpstra test instead of the Kruskal-Wallis H test.
It is important to realize that the Kruskal-Wallis H test is an omnibus test statistic and cannot tell you which specific groups of your independent variable are statistically significantly different from each other; it only tells you that at least two groups were different. Since you may have three, four, five or more groups in your study design, determining which of these groups differ from each other is important. You can do this using a post hoc test (N.B., we discuss post hoc tests later in this guide).
This "quick start" guide shows you how to carry out a Kruskal-Wallis H test using SPSS Statistics, as well as interpret and report the results from this test. However, before we introduce you to this procedure, you need to understand the different assumptions that your data must meet in order for a Kruskal-Wallis H test to give you a valid result. We discuss these assumptions next.
SPSS Statistics
Assumptions
When you choose to analyse your data using a Kruskal-Wallis H test, part of the process involves checking to make sure that the data you want to analyse can actually be analysed using a Kruskal-Wallis H test. You need to do this because it is only appropriate to use a Kruskal-Wallis H test if your data "passes" four assumptions that are required for a Kruskal-Wallis H test to give you a valid result. In practice, checking for these four assumptions just adds a little bit more time to your analysis, requiring you to click a few more buttons in SPSS Statistics when performing your analysis, as well as think a little bit more about your data, but it is not a difficult task.
Before we introduce you to these four assumptions, do not be surprised if, when analysing your own data using SPSS Statistics, one or more of these assumptions is violated (i.e., is not met). This is not uncommon when working with real-world data rather than textbook examples, which often only show you how to carry out a Kruskal-Wallis H test when everything goes well! However, don’t worry. Even when your data fails certain assumptions, there is often a solution to overcome this. First, let’s take a look at these four assumptions:
- Assumption #1: Your dependent variable should be measured at the ordinal or continuous level (i.e., interval or ratio). Examples of ordinal variables include Likert scales (e.g., a 7-point scale from "strongly agree" through to "strongly disagree"), amongst other ways of ranking categories (e.g., a 3-pont scale explaining how much a customer liked a product, ranging from "Not very much", to "It is OK", to "Yes, a lot"). Examples of continuous variables include revision time (measured in hours), intelligence (measured using IQ score), exam performance (measured from 0 to 100), weight (measured in kg), and so forth. You can learn more about ordinal and continuous variables in our article: Types of Variable.
- Assumption #2: Your independent variable should consist of two or more categorical, independent groups. Typically, a Kruskal-Wallis H test is used when you have three or more categorical, independent groups, but it can be used for just two groups (i.e., a Mann-Whitney U test is more commonly used for two groups). Example independent variables that meet this criterion include ethnicity (e.g., three groups: Caucasian, African American and Hispanic), physical activity level (e.g., four groups: sedentary, low, moderate and high), profession (e.g., five groups: surgeon, doctor, nurse, dentist, therapist), and so forth.
- Assumption #3: You should have independence of observations, which means that there is no relationship between the observations in each group or between the groups themselves. For example, there must be different participants in each group with no participant being in more than one group. This is more of a study design issue than something you can test for, but it is an important assumption of the Kruskal-Wallis H test. If your study fails this assumption, you will need to use another statistical test instead of the Kruskal-Wallis H test (e.g., a Friedman test). If you are unsure whether your study meets this assumption, you can use our Statistical Test Selector, which is part of our enhanced content.
As the Kruskal-Wallis H test does not assume normality in the data and is much less sensitive to outliers, it can be used when these assumptions have been violated and the use of a one-way ANOVA is inappropriate. In addition, if your data is ordinal, a one-way ANOVA is inappropriate, but the Kruskal-Wallis H test is not. However, the Kruskal-Wallis H test does come with an additional data consideration, Assumption #4, which is discussed below:
- Assumption #4: In order to know how to interpret the results from a Kruskal-Wallis H test, you have to determine whether the distributions in each group (i.e., the distribution of scores for each group of the independent variable) have the same shape (which also means the same variability). To understand what this means, take a look at the diagram below:

Copyright 2014. Laerd Statistics
In the diagram on the left above, the distribution of scores for the "Caucasian", "African American" and "Hispanic" groups have the same shape. On the other hand, in the diagram on the right above, the distribution of scores for each group are not identical (i.e., they have different shapes and variabilities).
If your distributions have the same shape, you can use SPSS Statistics to carry out a Kruskal-Wallis H test to compare the medians of your dependent variable (e.g., "engagement score") for the different groups of the independent variable you are interested in (e.g., the groups, Caucasian, African American and Hispanic, for the independent variable, "ethnicity"). However, if your distributions have a different shape, you can only use the Kruskal-Wallis H test to compare mean ranks. Having similar distributions simply allows you to use medians to represent a shift in location between the groups (as illustrated in the diagram on the left above). As such, it is very important to check this assumption or you can end up interpreting your results incorrectly.

You can check assumption #4 using SPSS Statistics. You should also check that your data meets assumptions #1, #2 and #3, which you can do without using SPSS Statistics. Just remember that if you do not check assumption #4, you will not know whether you are able to compare medians or just mean ranks, meaning that you might incorrectly interpret and report the result of the Kruskal-Wallis H test. This is why we dedicate a number of sections of our enhanced Kruskal-Wallis H test guide to help you get this right. You can learn more about assumption #4 and what you will need to interpret in the Assumptions section of our enhanced Kruskal-Wallis H test guide, which you can access by subscribing to Laerd Statistics.
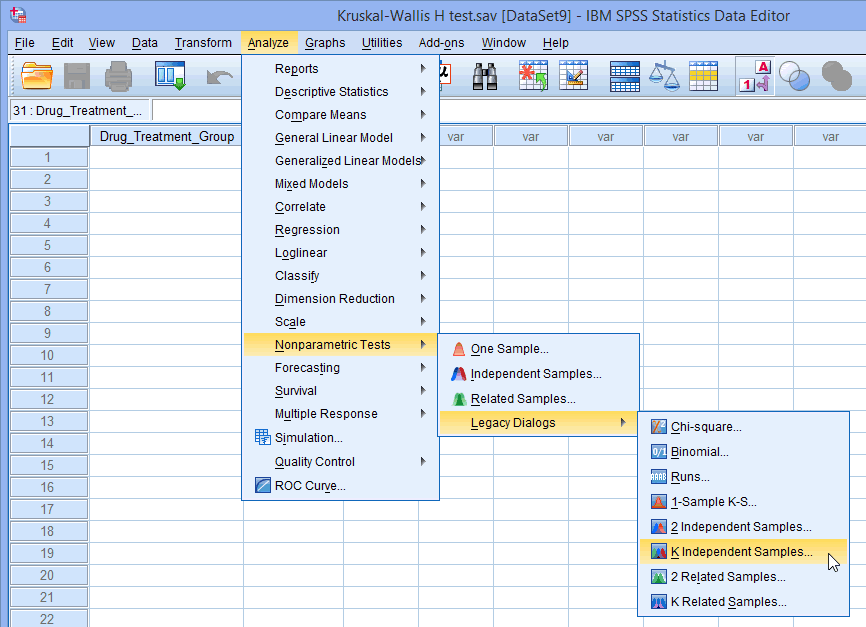
In the Test Procedure in SPSS Statistics section of this "quick start" guide, we illustrate the SPSS Statistics procedure to perform a Kruskal-Wallis H test assuming that your distributions are not the same shape and you have to interpret mean ranks rather than medians. First, we set out the example we use to explain the Kruskal-Wallis H test procedure in SPSS Statistics.
SPSS Statistics
Example
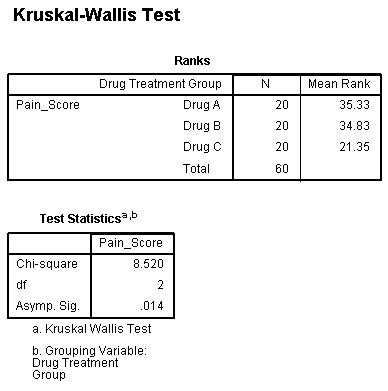
A medical researcher has heard anecdotal evidence that certain anti-depressive drugs can have the positive side-effect of lowering neurological pain in those individuals with chronic, neurological back pain, when administered in doses lower than those prescribed for depression. The medical researcher would like to investigate this anecdotal evidence with a study. The researcher identifies 3 well-known, anti-depressive drugs which might have this positive side effect, and labels them Drug A, Drug B and Drug C. The researcher then recruits a group of 60 individuals with a similar level of back pain and randomly assigns them to one of three groups – Drug A, Drug B or Drug C treatment groups – and prescribes the relevant drug for a 4 week period. At the end of the 4 week period, the researcher asks the participants to rate their back pain on a scale of 1 to 10, with 10 indicating the greatest level of pain. The researcher wants to compare the levels of pain experienced by the different groups at the end of the drug treatment period. The researcher runs a Kruskal-Wallis H test to compare this ordinal, dependent measure (Pain_Score) between the three drug treatments (i.e., the independent variable, Drug_Treatment_Group, is the type of drug with more than two groups).